Bio326.RNAseq
Marie Saitou
2/4/2021
Last updated: 2021-02-04
Checks: 7 0
Knit directory: Bio326/
This reproducible R Markdown analysis was created with workflowr (version 1.6.2). The Checks tab describes the reproducibility checks that were applied when the results were created. The Past versions tab lists the development history.
Great! Since the R Markdown file has been committed to the Git repository, you know the exact version of the code that produced these results.
Great job! The global environment was empty. Objects defined in the global environment can affect the analysis in your R Markdown file in unknown ways. For reproduciblity it’s best to always run the code in an empty environment.
The command set.seed(20210128) was run prior to running the code in the R Markdown file. Setting a seed ensures that any results that rely on randomness, e.g. subsampling or permutations, are reproducible.
Great job! Recording the operating system, R version, and package versions is critical for reproducibility.
Nice! There were no cached chunks for this analysis, so you can be confident that you successfully produced the results during this run.
Great job! Using relative paths to the files within your workflowr project makes it easier to run your code on other machines.
Great! You are using Git for version control. Tracking code development and connecting the code version to the results is critical for reproducibility.
The results in this page were generated with repository version 47dfe76. See the Past versions tab to see a history of the changes made to the R Markdown and HTML files.
Note that you need to be careful to ensure that all relevant files for the analysis have been committed to Git prior to generating the results (you can use wflow_publish or wflow_git_commit). workflowr only checks the R Markdown file, but you know if there are other scripts or data files that it depends on. Below is the status of the Git repository when the results were generated:
Ignored files:
    Ignored:    .DS_Store

Untracked files:
    Untracked:  BIO326-RNAseq.pptx
    Untracked:  BIO326-genome/
    Untracked:  BIO326_Introduction to sequence technology and protocols_3rd_FEB_2021.pdf
    Untracked:  BIO326_Introduction to sequence technology and protocols_3rd_FEB_2021.pptx
    Untracked:  BIO326_Introduction to sequence technology and protocols_5th_FEB_2021.pptx
    Untracked:  Bio326.genome.html
    Untracked:  RNAseq.Rplot.pdf
    Untracked:  workflowR.bio326.R
    Untracked:  ~$BIO326_Introduction to sequence technology and protocols_5th_FEB_2021.pptx
Note that any generated files, e.g. HTML, png, CSS, etc., are not included in this status report because it is ok for generated content to have uncommitted changes.
These are the previous versions of the repository in which changes were made to the R Markdown (analysis/Bio326.RNAseq.Rmd) and HTML (docs/Bio326.RNAseq.html) files. If you’ve configured a remote Git repository (see ?wflow_git_remote), click on the hyperlinks in the table below to view the files as they were in that past version.
| File | Version | Author | Date | Message |
|---|---|---|---|---|
| Rmd | 47dfe76 | mariesaitou | 2021-02-04 | Add my first analysis |
| html | 3b17d7a | mariesaitou | 2021-02-04 | Build site. |
| Rmd | 18ed399 | mariesaitou | 2021-02-04 | Add my first analysis |
| html | d110479 | mariesaitou | 2021-02-04 | Build site. |
| Rmd | a3850b1 | mariesaitou | 2021-02-04 | image data set |
| html | ad166a1 | mariesaitou | 2021-02-04 | Build site. |
| Rmd | 8e170de | mariesaitou | 2021-02-04 | Add my first analysis |
This workflow is based on Galaxy Training materials aimed for the two-hour courses in Bio326, NMBU 2021.
Previous Lesson * 1.Genome Analysis
The workflow is based on the following material but modified for Galaxy.no 2021.
RNAseq gene extraction vidualization
0. Goal of this workflow
Objective: Compare the gene expression pattern of fruit fly with and without RNA interference treatment of Pasilla gene.
We will learn: A.How to prepare gene expression matrix from raw sequencing reads, B. How to conduct downstream analyses on deferentially expressed genes
1. From raw reads to gene expression matrix
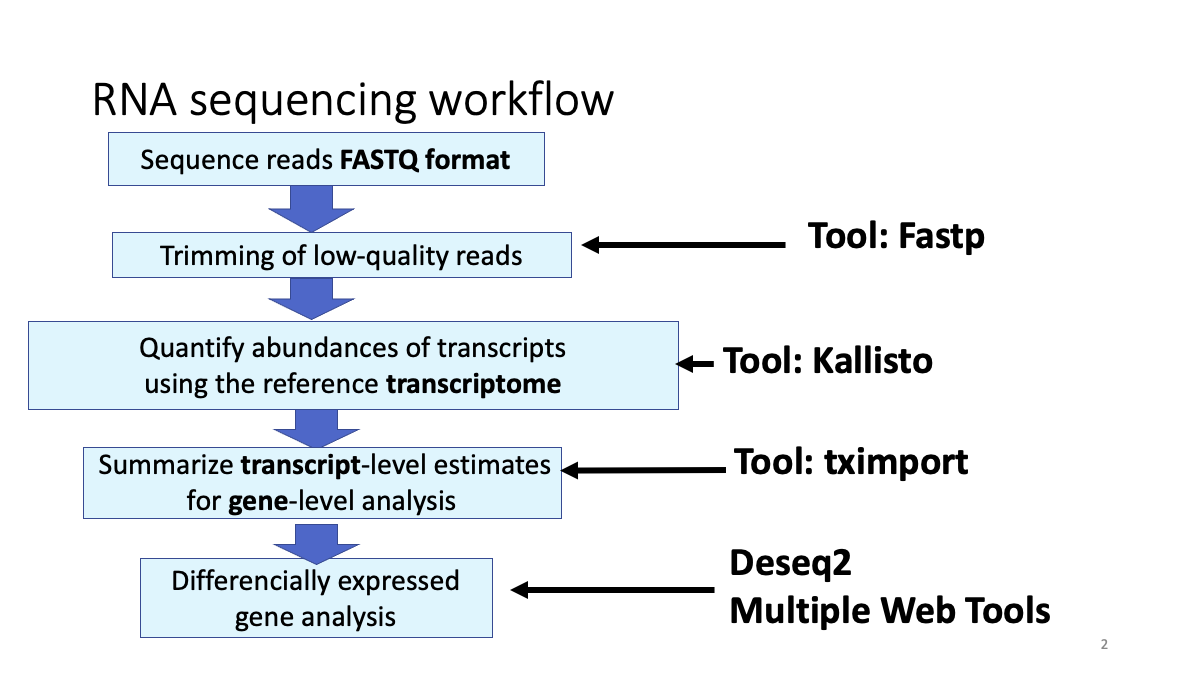
1-1. Review the RNA-seq analysis workflow
 ## 1-2. Get the Data
There are four groups and seven individuals in total.
- paired end sequencing, RNAi-treated
- single end sequencing, RNAi-treated
- paired end sequencing, not treated
- single end sequencing, nottreated
However, since each data is huge and takes long time to upload all, let’s use the PE_untreated files to learn the initial analysis. I will provide you all the processed data sets later.
—- PE_untreated (please use this) —- Please make a new history and import the data four files. You can always go back to the previous material to review the process. Rename the files as you like.
https://zenodo.org/record/1185122/files/GSM461177_1.fastqsanger
https://zenodo.org/record/1185122/files/GSM461177_2.fastqsanger
https://zenodo.org/record/1185122/files/GSM461178_1.fastqsanger
https://zenodo.org/record/1185122/files/GSM461178_2.fastqsanger
—- PE_treated (you don’t have to use the following files for now)
https://zenodo.org/record/1185122/files/GSM461180_1.fastqsanger
https://zenodo.org/record/1185122/files/GSM461180_2.fastqsanger
https://zenodo.org/record/1185122/files/GSM461181_1.fastqsanger
https://zenodo.org/record/1185122/files/GSM461181_2.fastqsanger
—- SE_untreated
https://zenodo.org/record/1185122/files/GSM461176.fastqsanger
https://zenodo.org/record/1185122/files/GSM461182.fastqsanger
—- SE_treated
https://zenodo.org/record/1185122/files/GSM461179.fastqsanger1-3. Filter the bad-quality reads with fastp like the previous genome analysis.
Conduct fastp to each file. When your input used paired-end sequencing (you input two files), fastp will give you back two files, “Read 1 output” and “Read 2 output”.
OK, next step is new! We will quantify abundances of transcripts using the reference transcriptome.
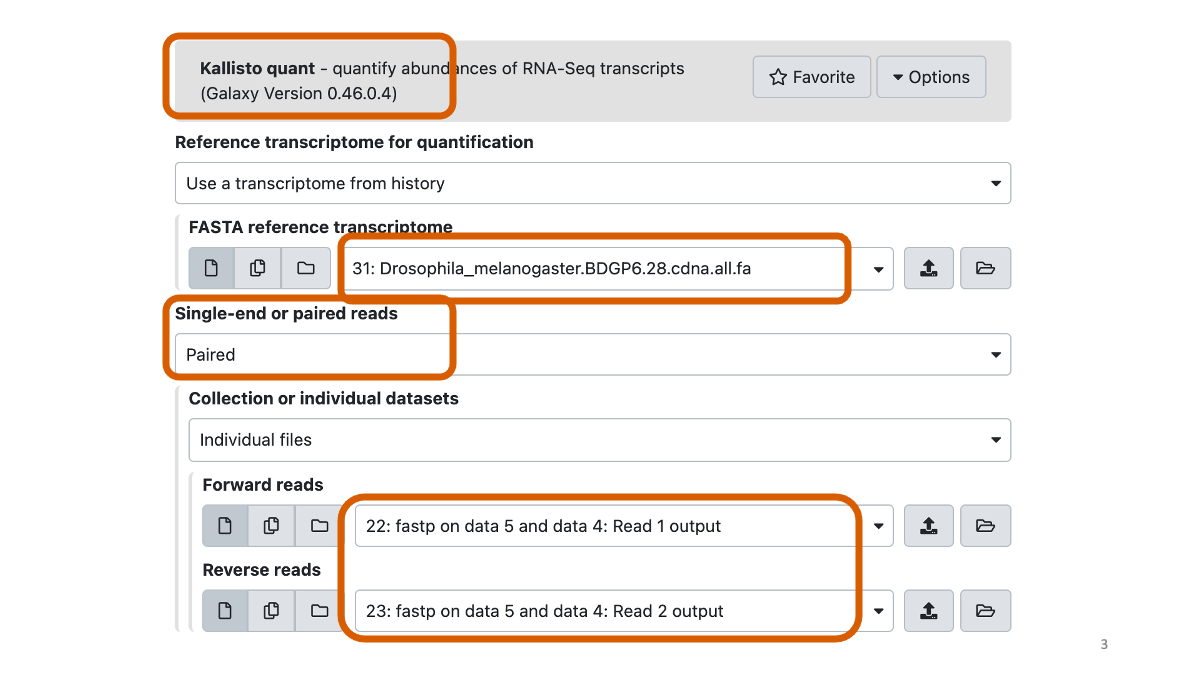
We will use the latest (2021) fly reference transctiptome. Please find and import .all.fa file from here. https://github.com/mariesaitou/Bio326/tree/master/docs/assets/BIO326-transcriptome
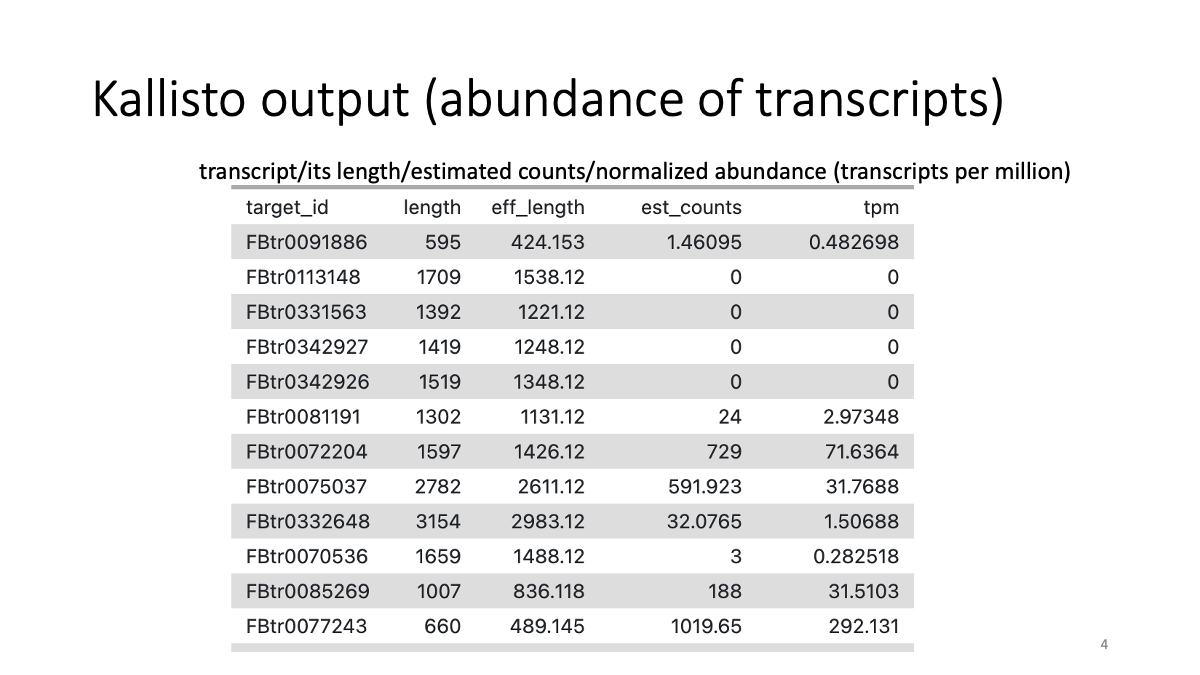
1-4. Quantify abundances of transcripts with Kallisto
https://pachterlab.github.io/kallisto/manual
 Let’s briefly have a look on the data with the eye icon.
1-5. Summarize transcripts into genes with tximport.
We will use a file contains gene/transcript information for the conversion:
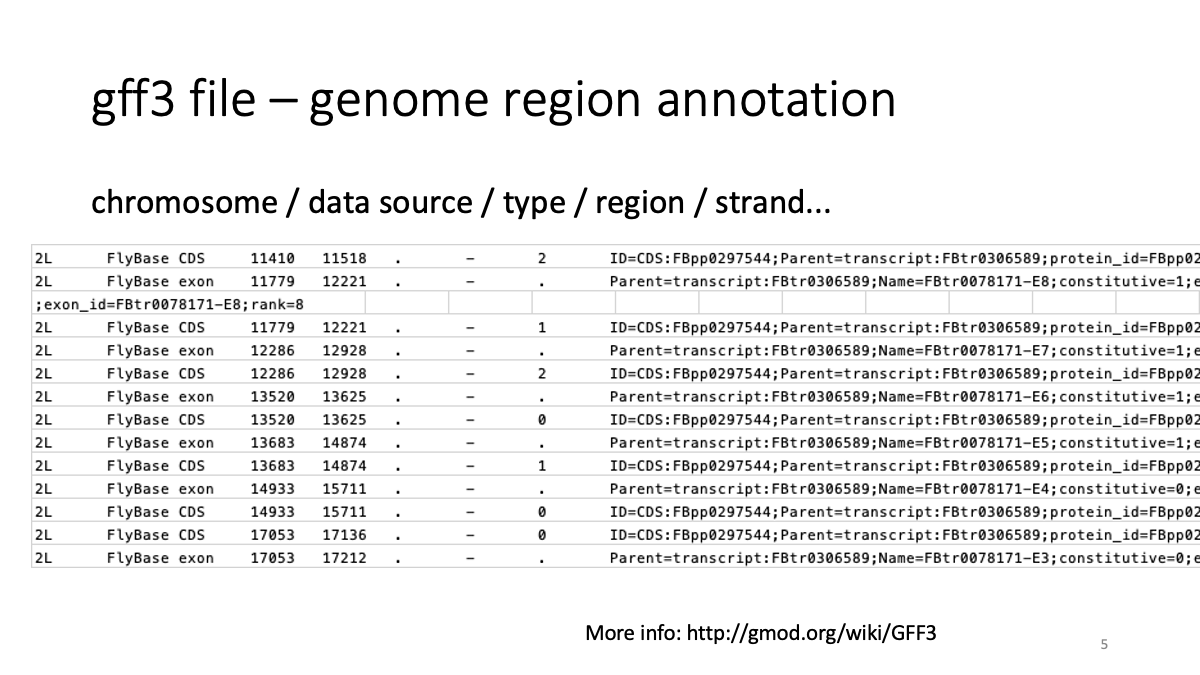
Find the .gff3 file and upload it to your workplace. https://github.com/mariesaitou/Bio326/tree/master/docs/assets/BIO326-transcriptome
Let’s briefly have a look on the gff3 file. More info: http://gmod.org/wiki/GFF3
 Run tximport with the Kallisto output (two files for two individuals, for each) with the GFF3 file.
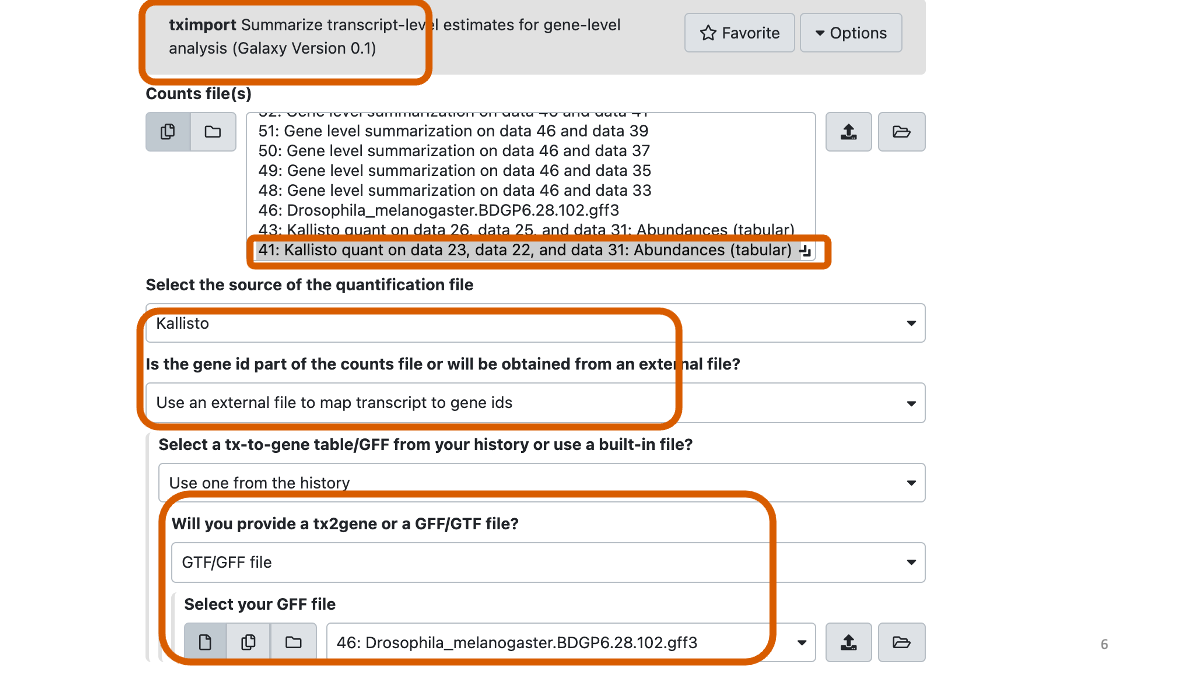
You can see gene names and gene abundance in the output file. 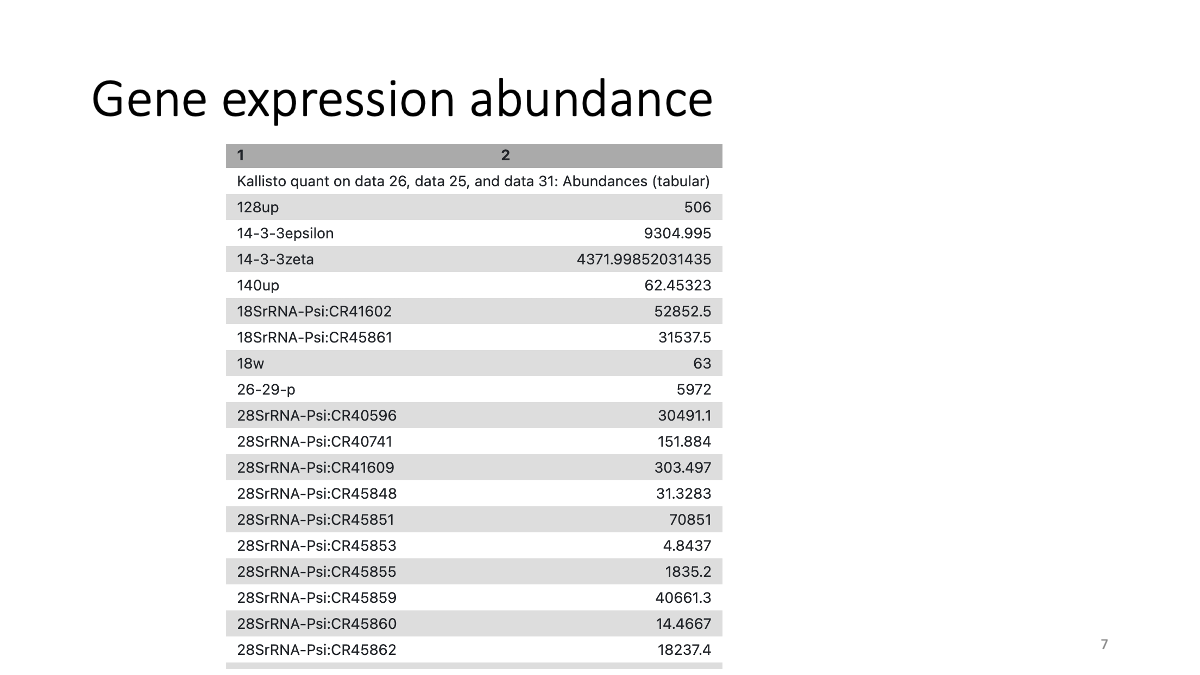
2. Differencially expressed gene analysis
2-1. Prepare the data
Now, I pre-made the gene abundance table of seven individuals. Remember that there are four groups and seven individuals in total.
- paired end sequencing, RNAi-treated
- single end sequencing, RNAi-treated
- paired end sequencing, not treated
- single end sequencing, not treated
Download all the .tsv files (seven) here: https://github.com/mariesaitou/Bio326/tree/master/docs/assets/BIO326-transcriptome
You may need to make sure that the data format is “tabular”. 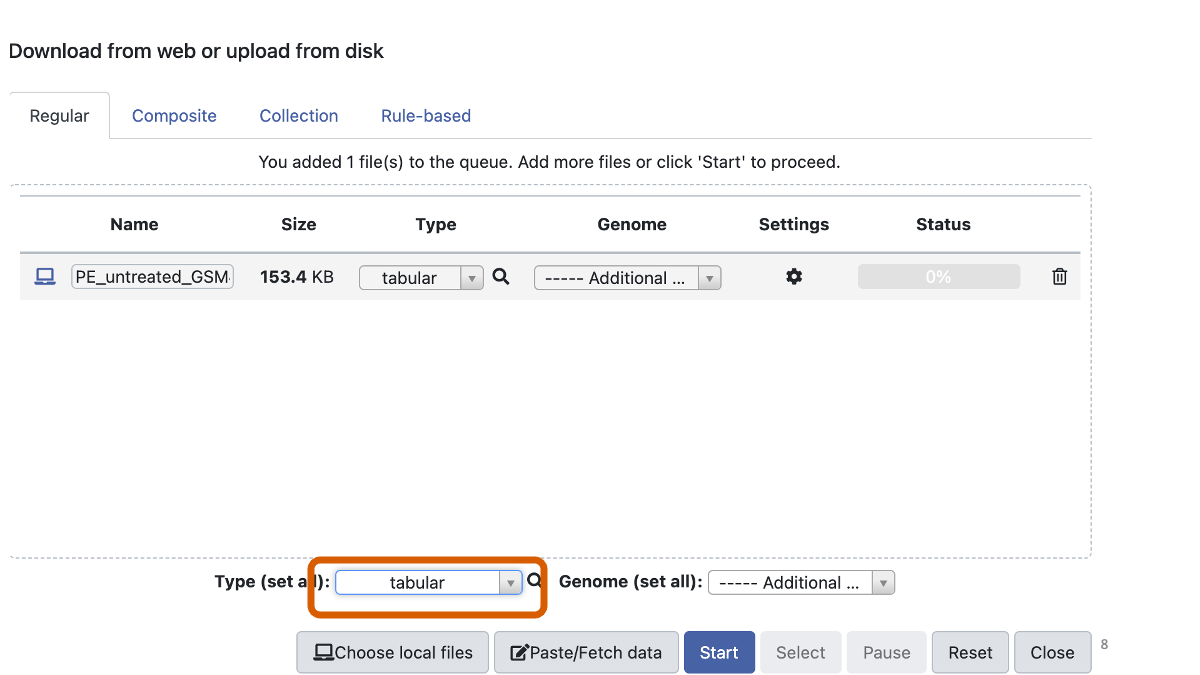
2-2. DeSeq
Deseq runs various analyses on RNA-sequencing data. We need to input what condition we want to compare. Here, our main perpose is to know the effect of RNAi. Additionally, the sequencing platform (single-end or paired-end) may have affected.
DESeq2  parameters:
“how”: Select datasets per level
In “1: Factor”
“Specify a factor name”: Treatment
In “1: Factor level”:
“Specify a factor level”: treated
param-files “Counts file(s)”: the 3 gene count files with treat in their name
In “2: Factor level”:
“Specify a factor level”: untreated
param-files “Counts file(s)”: the 4 gene count files with untreat in their name
Click on param-repeat “Insert Factor” (not on “Insert Factor level”)
In “2: Factor”
“Specify a factor name” to Sequencing
In “1: Factor level”:
“Specify a factor level”: PE
param-files “Counts file(s)”: the 4 gene count files with paired in their name
In “2: Factor level”:
“Specify a factor level”: SE
param-files “Counts file(s)”: the 3 gene count files with single in their name
“Files have header?”: No
“Visualising the analysis results”: Yes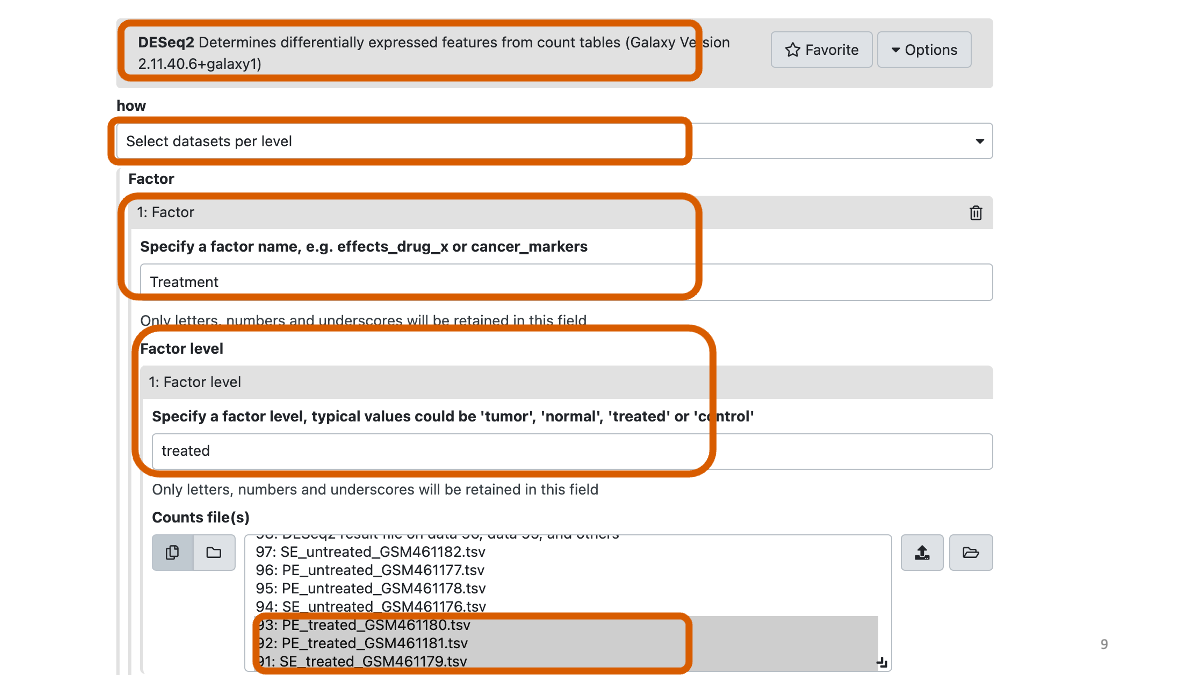
2-3. Examine the results.
First, take a look on the DESeq “result file”. It contains the result of differencially expressed gene analysis for the RNAi reatment. 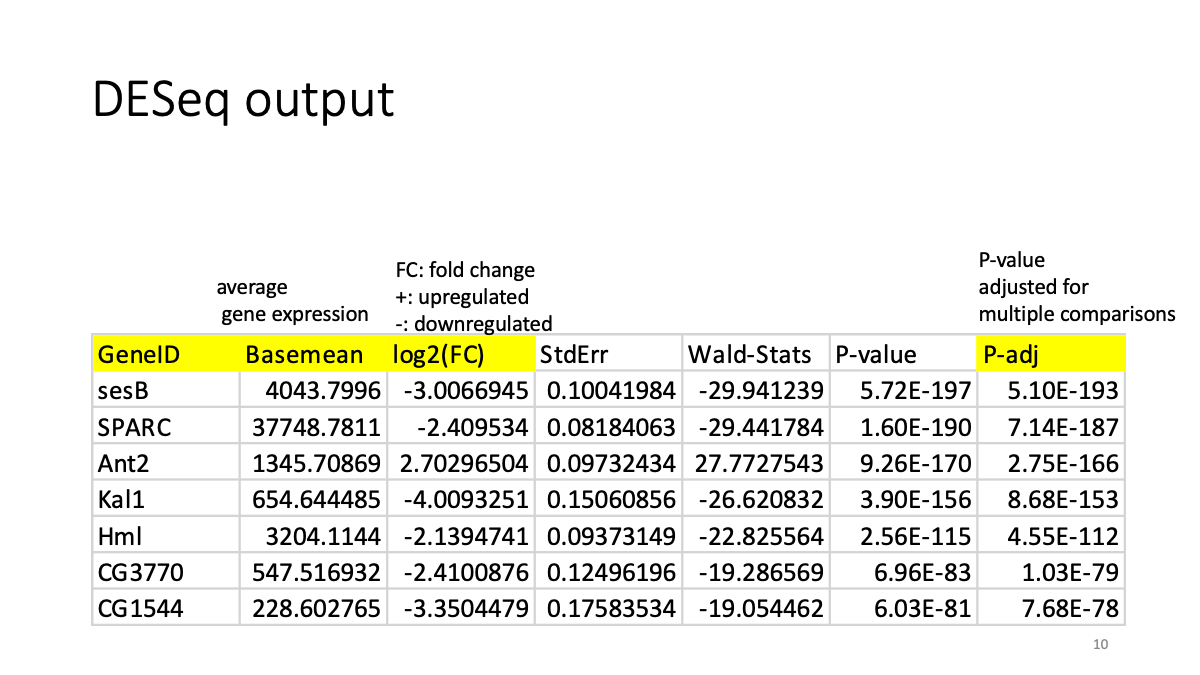
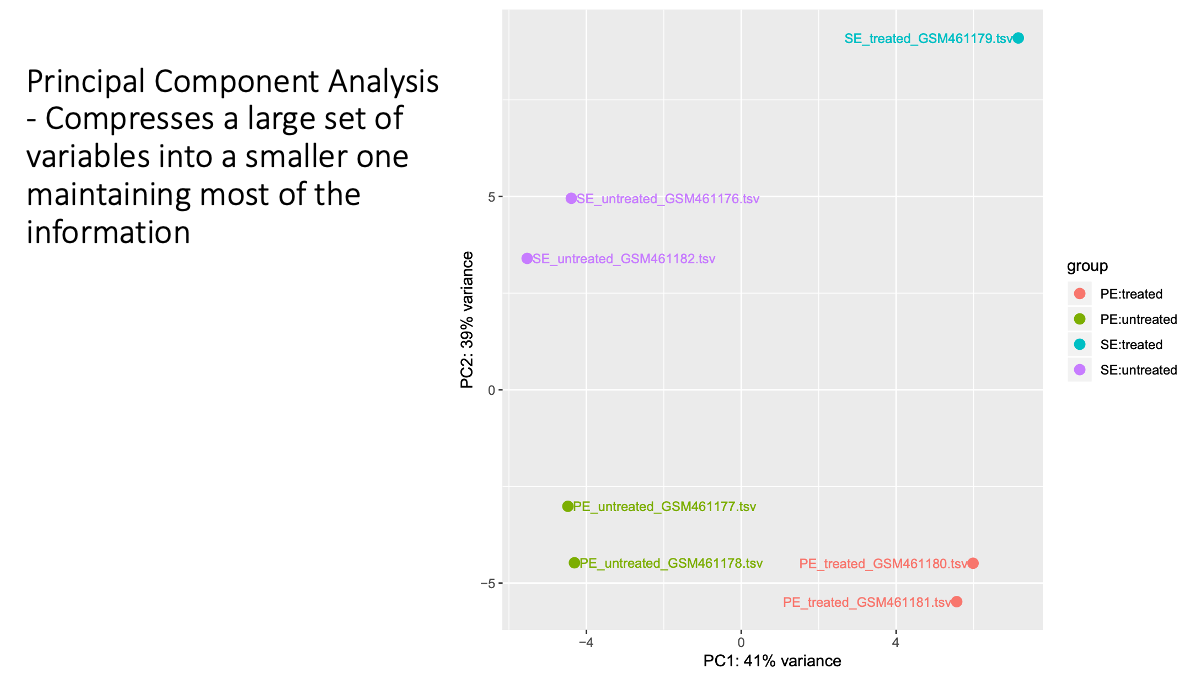
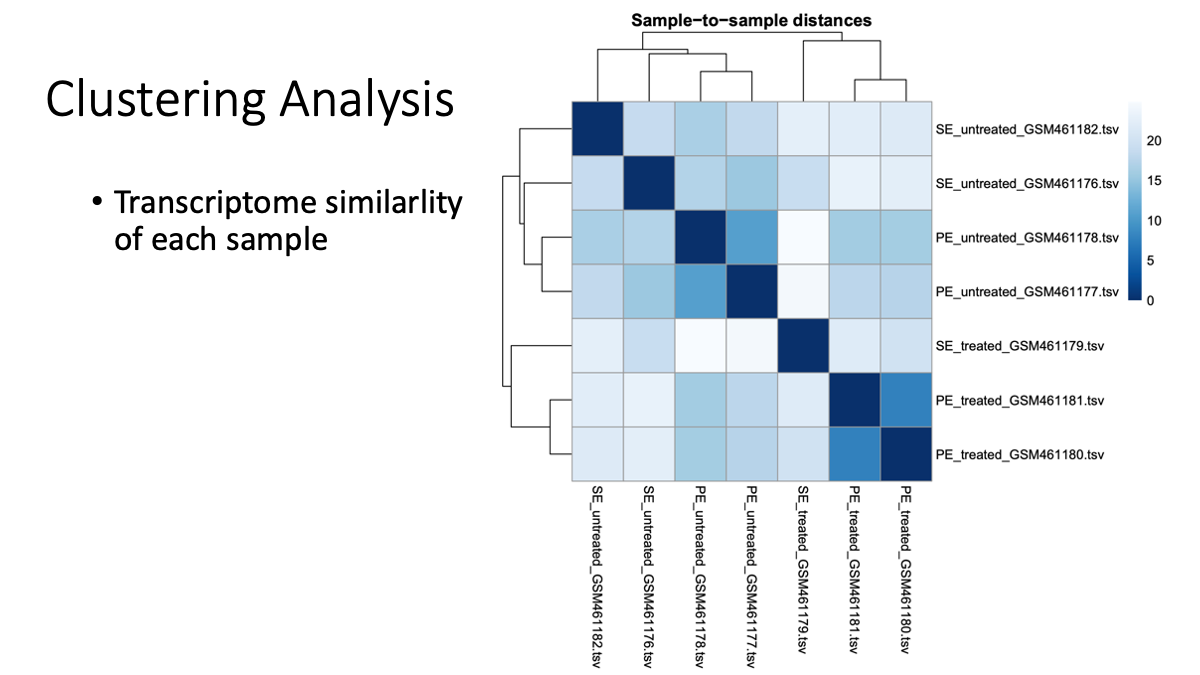
Next, take a look on the DESeq “plots”. They will tell you the overall trend.
Let’s examine the transcriptome difference/smilarlity between samples/conditions.
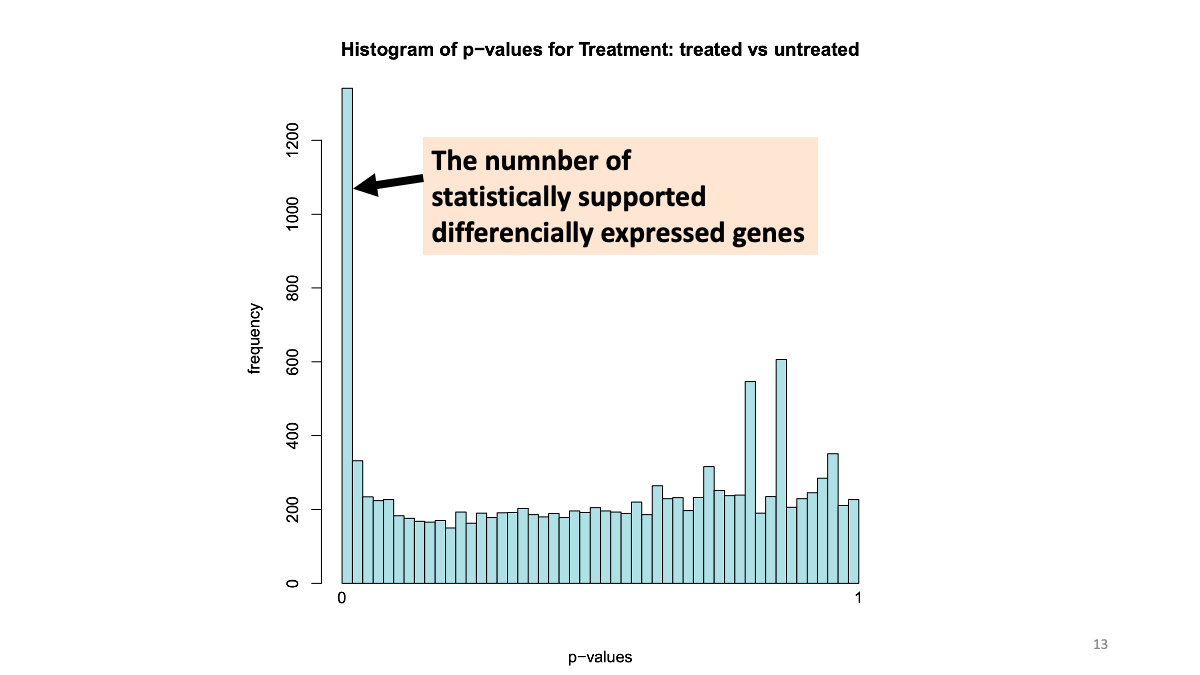
What is a p-value? In statistics, the p-value is the probability of obtaining results as “extreme” as the observed results of a statistical hypothesis test, assuming that the null hypothesis is correct. We will discuss this later as well.
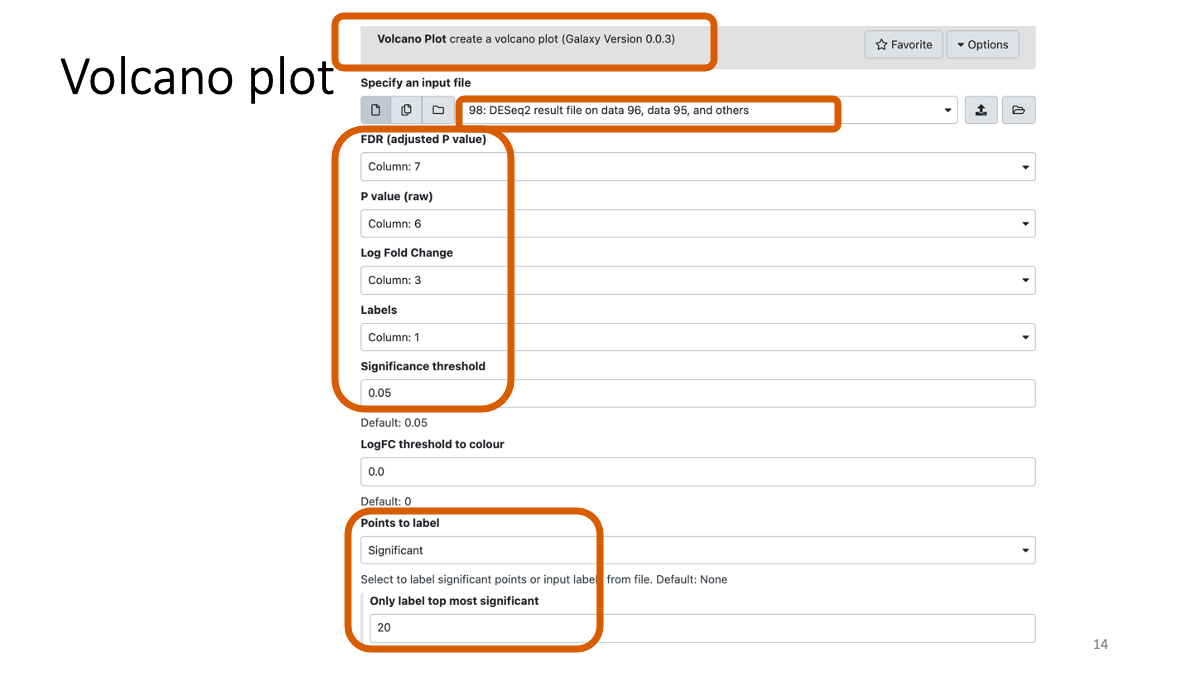
2-4. Volcano plot
Visualize the log2 fold change and adjusted p-value simultaniously.
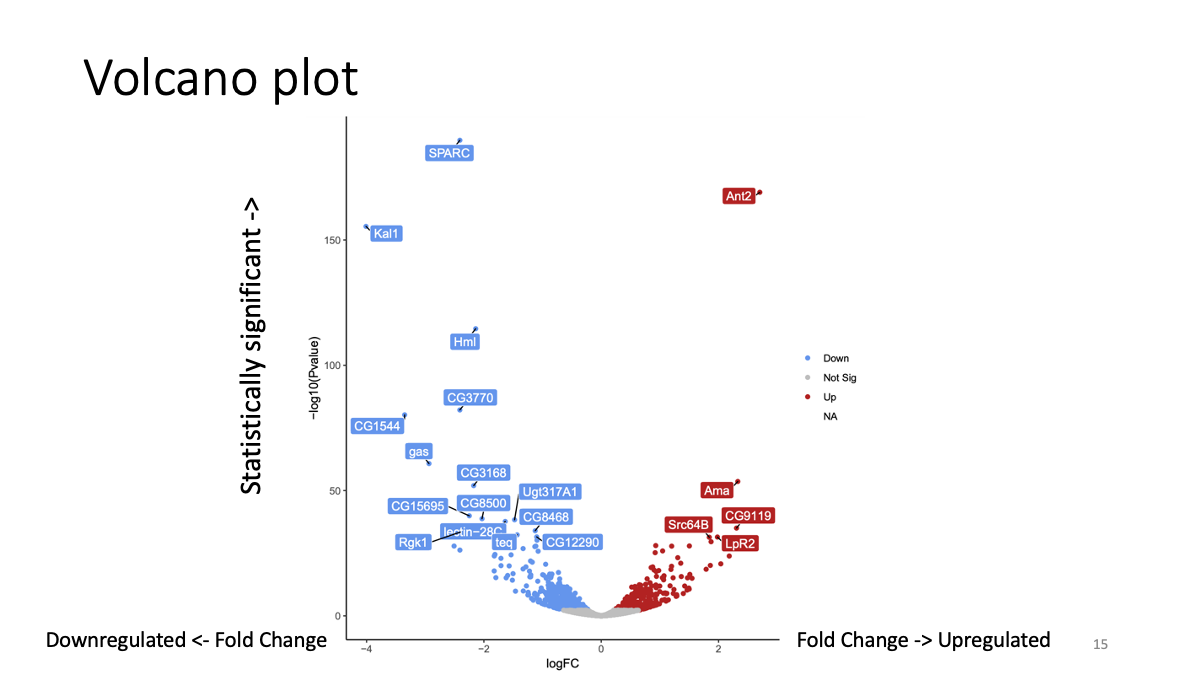 ## 2-6. Examine gene functions Pick up a couple of genes with color (top differenciated)), and search for the genes in this database to investigate their known function. (top-right, junp to gene) https://flybase.org/
2-7. Extract differencially expressed genes
Reformat the DESeq2 result. What we will do is very simple but the Galaxy operation may be tricky.
Clock the top-left “Download from URL …” icon.
Copy and paste “GeneID Basemean log2(FC) StdErr Wald-Stats P-value P-adj” You may need to change the datatype to tabular.
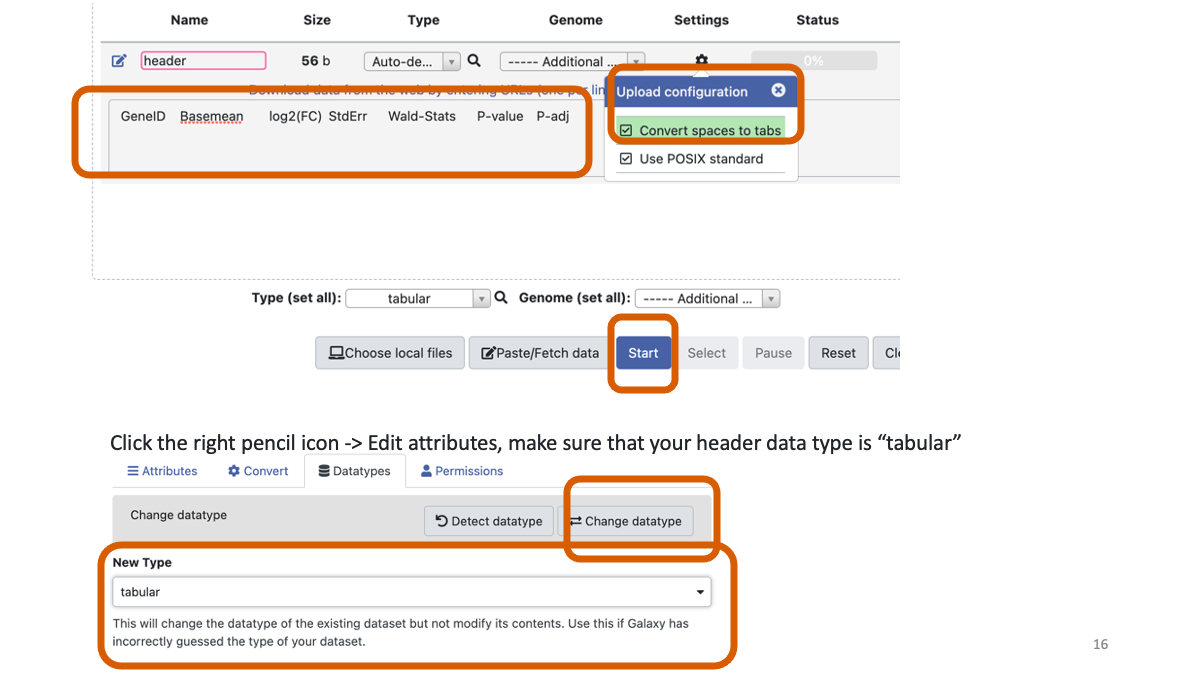
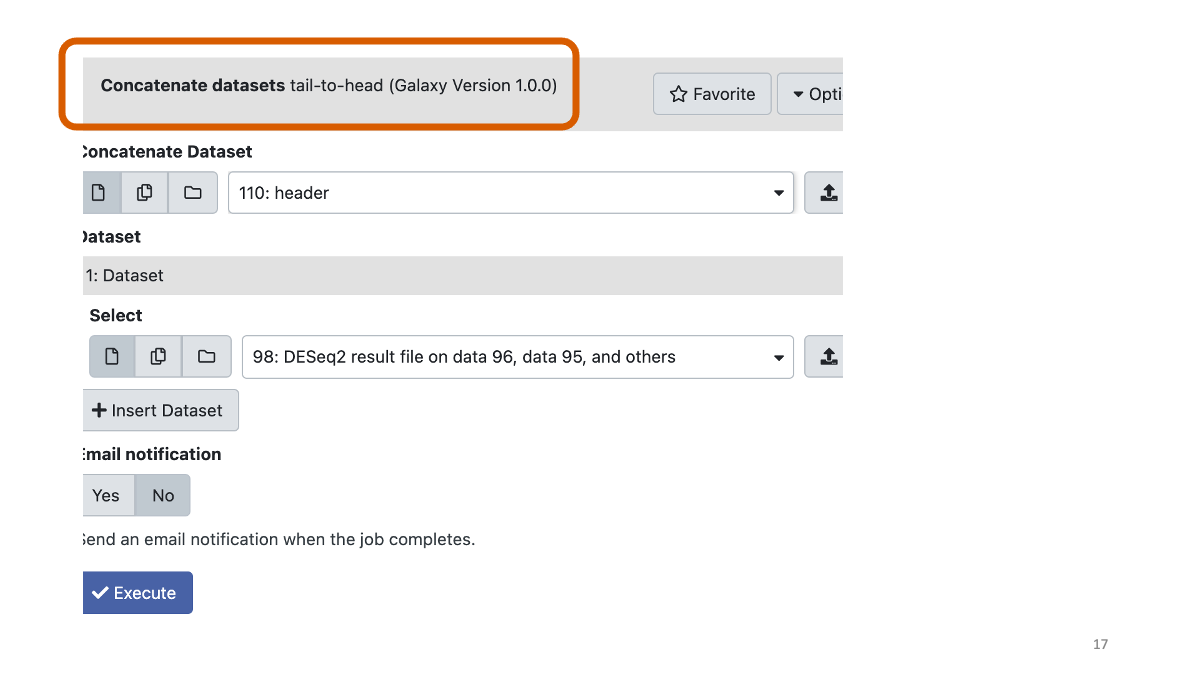
Concatenate the header you made above with the DESeq result.
Extract the genes with adjusted p-value less than 0.01. 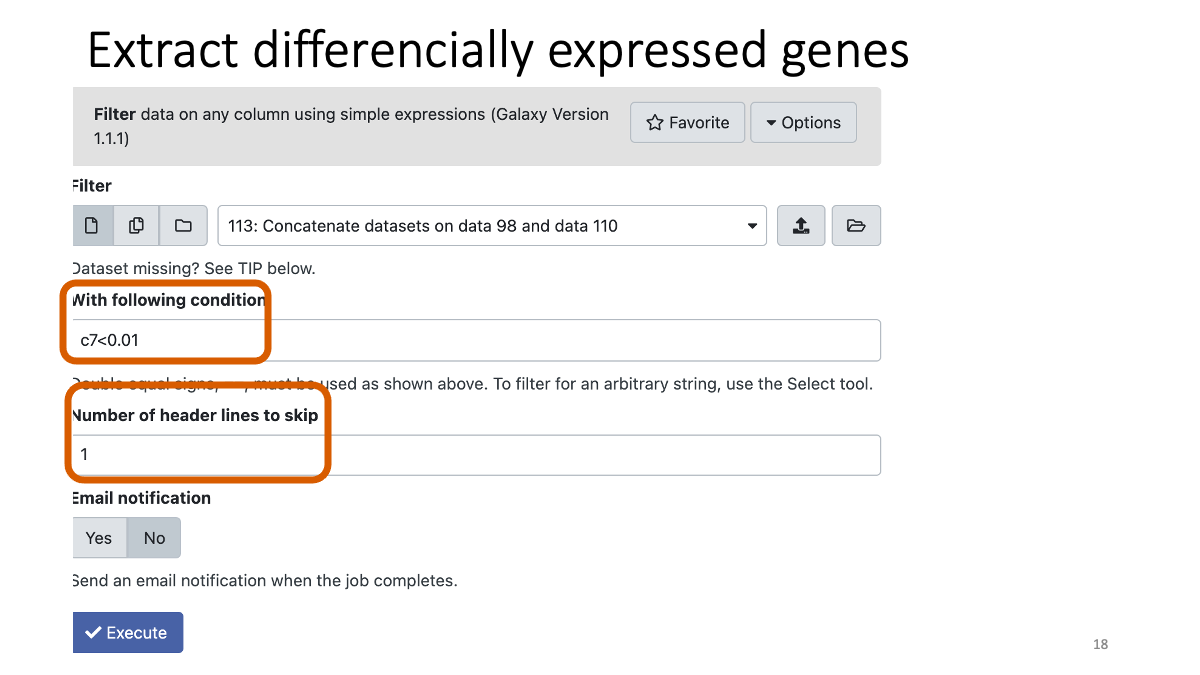
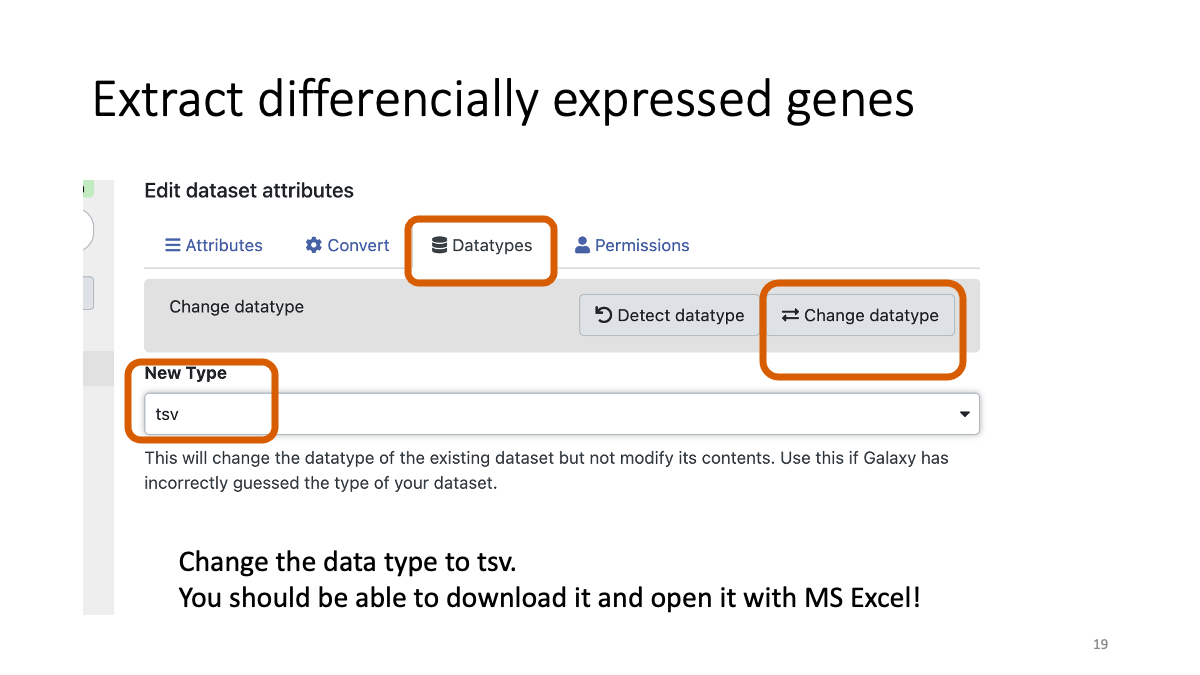
Convert the datatype of extracted gene file to tsv. By doing so, you can download the file and examine it with Microsoft Excel etc.
Let’s have a look on genes in the downloaded files. How many genes did you get? Is it same as your teammates?
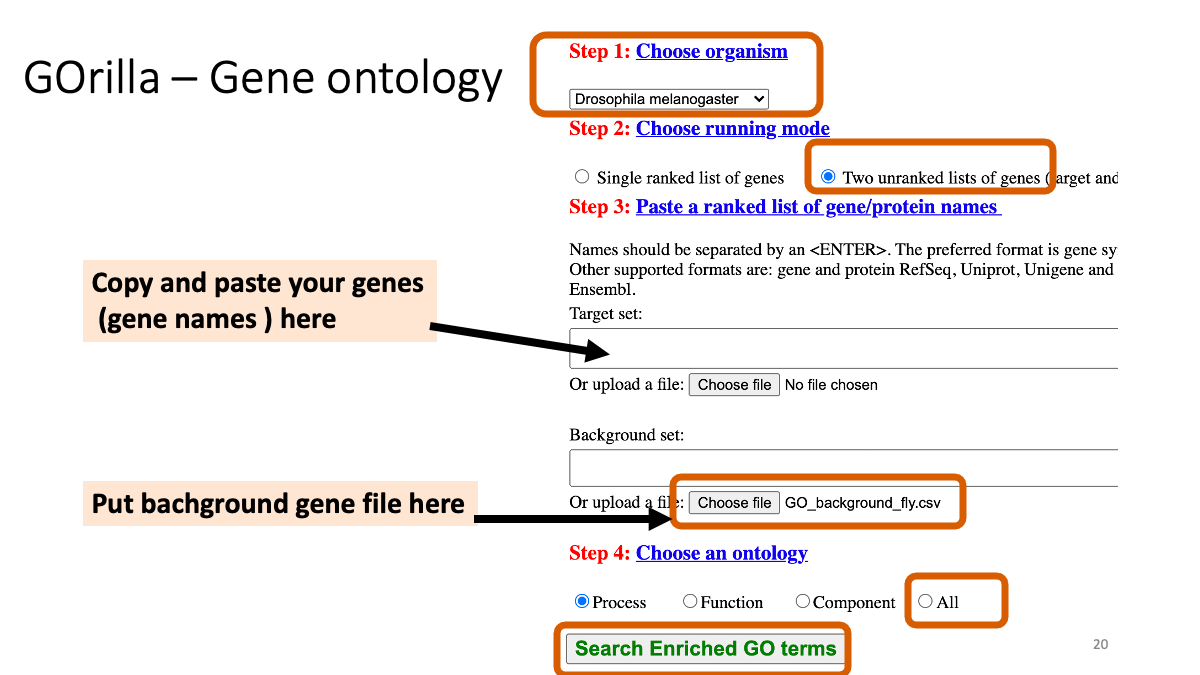
2-8. Gene Ontology analysis
Let’s examine the function of differencially expressed genes. Go to http://cbl-gorilla.cs.technion.ac.il/
 Download the “GO_background” file. (All the genes are described). https://github.com/mariesaitou/Bio326/tree/master/docs/assets/BIO326-transcriptome
Input the differencially expressed gene names and background gene file. 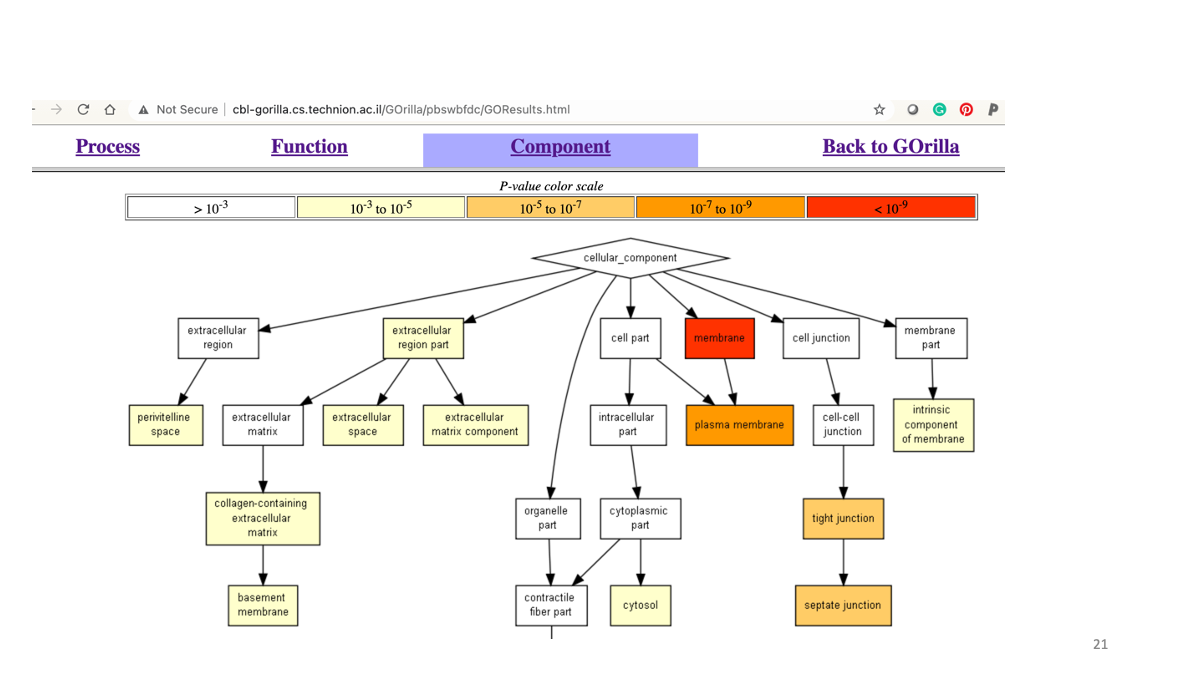
Explore the website and examine the potenfial function of the target gene that are interferred by RNAi.
sessionInfo()R version 4.0.2 (2020-06-22)
Platform: x86_64-apple-darwin17.0 (64-bit)
Running under: macOS 10.16
Matrix products: default
BLAS: /Library/Frameworks/R.framework/Versions/4.0/Resources/lib/libRblas.dylib
LAPACK: /Library/Frameworks/R.framework/Versions/4.0/Resources/lib/libRlapack.dylib
locale:
[1] en_US.UTF-8/en_US.UTF-8/en_US.UTF-8/C/en_US.UTF-8/en_US.UTF-8
attached base packages:
[1] stats graphics grDevices utils datasets methods base
other attached packages:
[1] workflowr_1.6.2
loaded via a namespace (and not attached):
[1] Rcpp_1.0.5 rstudioapi_0.11 whisker_0.4 knitr_1.30
[5] magrittr_1.5 R6_2.4.1 rlang_0.4.8 stringr_1.4.0
[9] tools_4.0.2 xfun_0.18 git2r_0.27.1 htmltools_0.5.0
[13] ellipsis_0.3.1 rprojroot_1.3-2 yaml_2.2.1 digest_0.6.27
[17] tibble_3.0.4 lifecycle_0.2.0 crayon_1.3.4 later_1.1.0.1
[21] vctrs_0.3.4 promises_1.1.1 fs_1.5.0 glue_1.4.2
[25] evaluate_0.14 rmarkdown_2.5 stringi_1.5.3 compiler_4.0.2
[29] pillar_1.4.6 backports_1.1.10 httpuv_1.5.4 pkgconfig_2.0.3