Bio322.ensembl1
Marie Saitou
8/23/2021
Last updated: 2021-09-18
Checks: 2 0
Knit directory: Bio322/
This reproducible R Markdown analysis was created with workflowr (version 1.6.2). The Checks tab describes the reproducibility checks that were applied when the results were created. The Past versions tab lists the development history.
Great! Since the R Markdown file has been committed to the Git repository, you know the exact version of the code that produced these results.
Great! You are using Git for version control. Tracking code development and connecting the code version to the results is critical for reproducibility.
The results in this page were generated with repository version 468dc7b. See the Past versions tab to see a history of the changes made to the R Markdown and HTML files.
Note that you need to be careful to ensure that all relevant files for the analysis have been committed to Git prior to generating the results (you can use wflow_publish or wflow_git_commit). workflowr only checks the R Markdown file, but you know if there are other scripts or data files that it depends on. Below is the status of the Git repository when the results were generated:
Ignored files:
    Ignored:    .DS_Store
    Ignored:    .Rhistory

Untracked files:
    Untracked:  BIO322_Teaching plan BIO322 2021.docx
    Untracked:  Bio322.09132021.pdf
    Untracked:  Bio322.09132021.pptx
    Untracked:  Bio322.09152021.backup.pptx
    Untracked:  Bio322.09152021.pdf
    Untracked:  Bio322.09152021.pptx
    Untracked:  Bio322.09202021.pptx
    Untracked:  Group.csv
    Untracked:  ~$Bio322.09202021.pptx
Note that any generated files, e.g. HTML, png, CSS, etc., are not included in this status report because it is ok for generated content to have uncommitted changes.
These are the previous versions of the repository in which changes were made to the R Markdown (analysis/ensembl2.Rmd) and HTML (docs/ensembl2.html) files. If you’ve configured a remote Git repository (see ?wflow_git_remote), click on the hyperlinks in the table below to view the files as they were in that past version.
| File | Version | Author | Date | Message |
|---|---|---|---|---|
| html | deb8939 | mariesaitou | 2021-09-18 | Build site. |
| html | 25c1a5e | mariesaitou | 2021-09-18 | Build site. |
| Rmd | 4f43a35 | mariesaitou | 2021-09-18 | wflow_publish(“analysis/ensembl2.Rmd”) |
0. Introduction
This is a set of introductory hands-on exercises to get to know more about human evolutionary and functional genomics with public databases. These exercises align with the learning goals from module 1 and lectures of Bio322. https://www.nmbu.no/course/BIO322
Relevant chapters: 8 and 9 of the textbook (Introduction to Genomics – 3rd edition. Oxford University Press.).
In this task, we will learn how to investigate the variant’s genomic context and its distribution among human populations. Also, we will learn how to search the genome-wide association study reports of a single nucleotide variant.
In this tutorial, we will focus on a single nucleotide variant, ID “rs348195”.
1. Ensembl Overview
Let’s search for “rs348195” in Ensembl.
You will find a “human variant”. Click it.
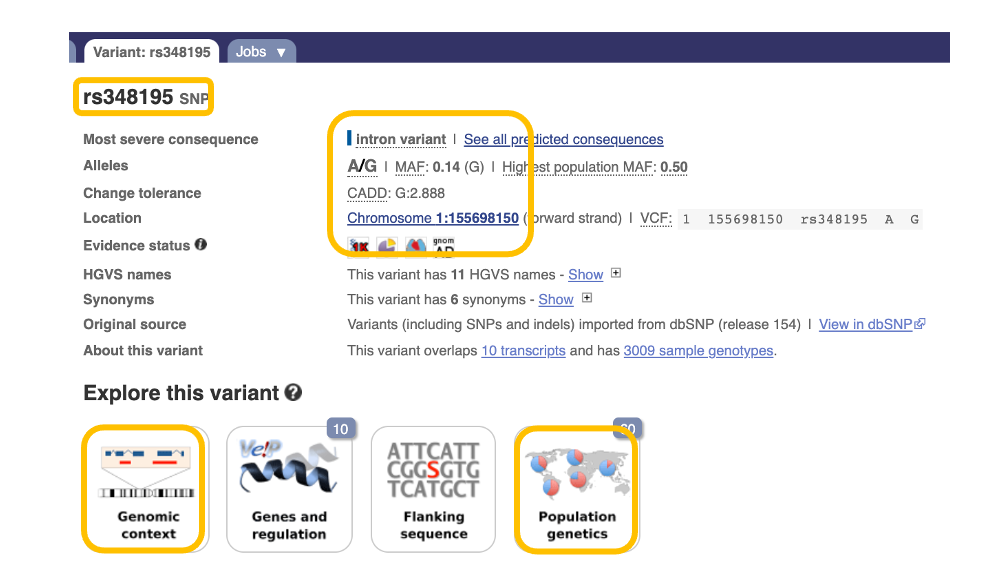
Now, you can see that it is an “intron variant at the chromosome1:155698150 (location on the chromosome). This is a polymorphism of A or G, so people have AA, AG, or GG genotypes”
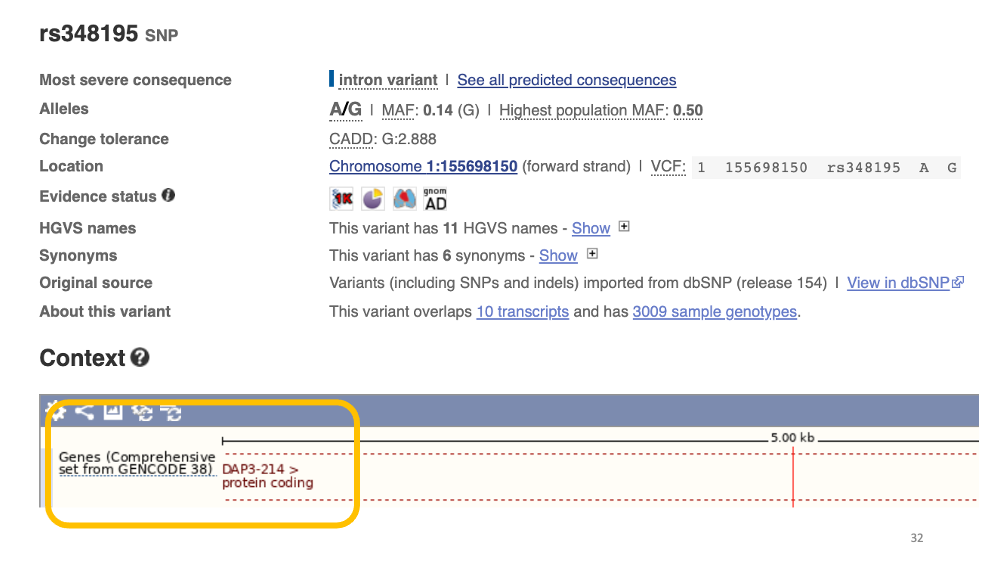
2. Genomic context
Now, Let’s click “Genomic context”. We can see that the variant is in an intronic region of the DAP3 gene.
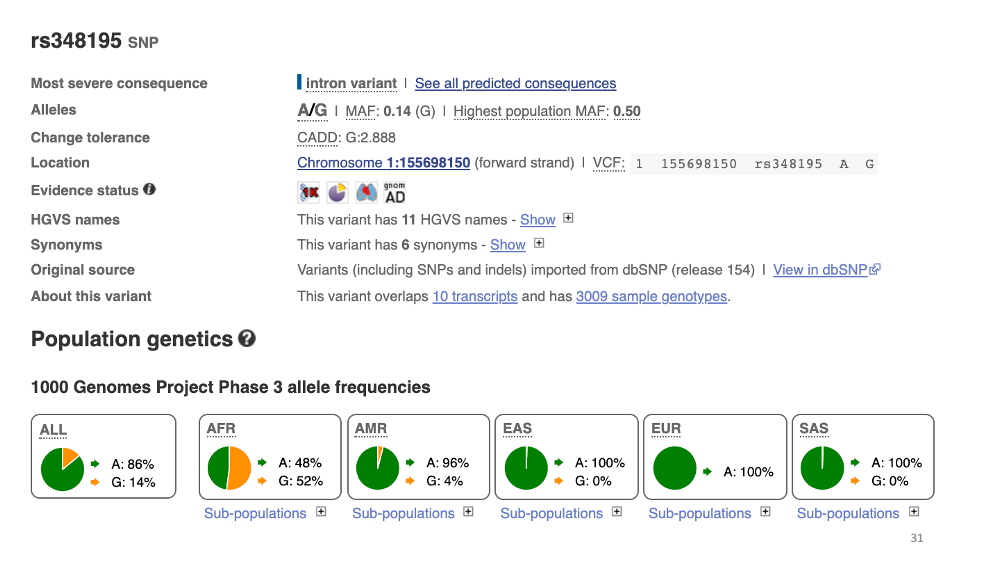
3. Global distribution of the variant
Go back to the previous page and click “population genetics”. Now you can see the population differentiation of this variant. G type is common in Africa, but rare in other populations.
You can check the abbreviations with this table: 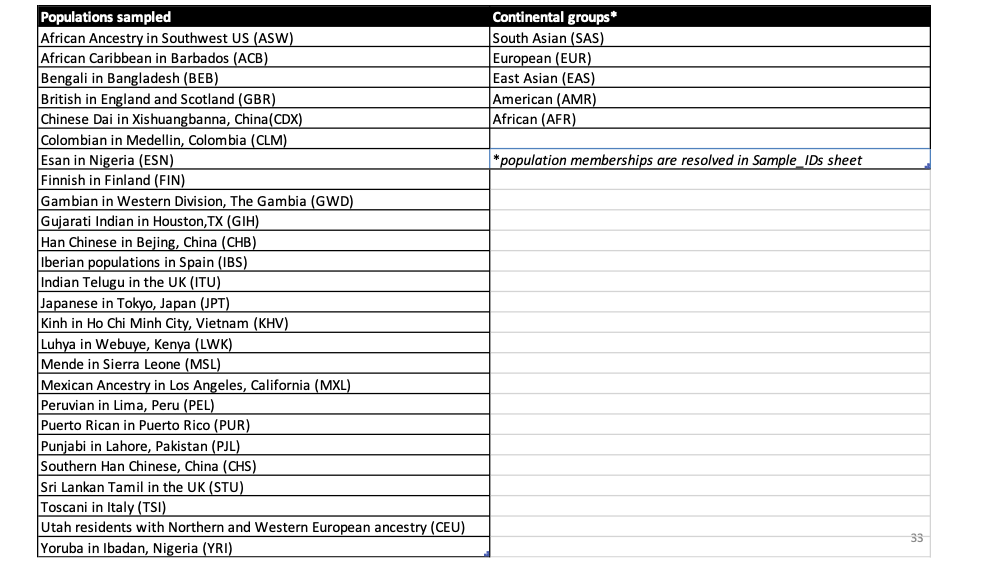
You can also see a map
4. Association between a variant and phenotypes
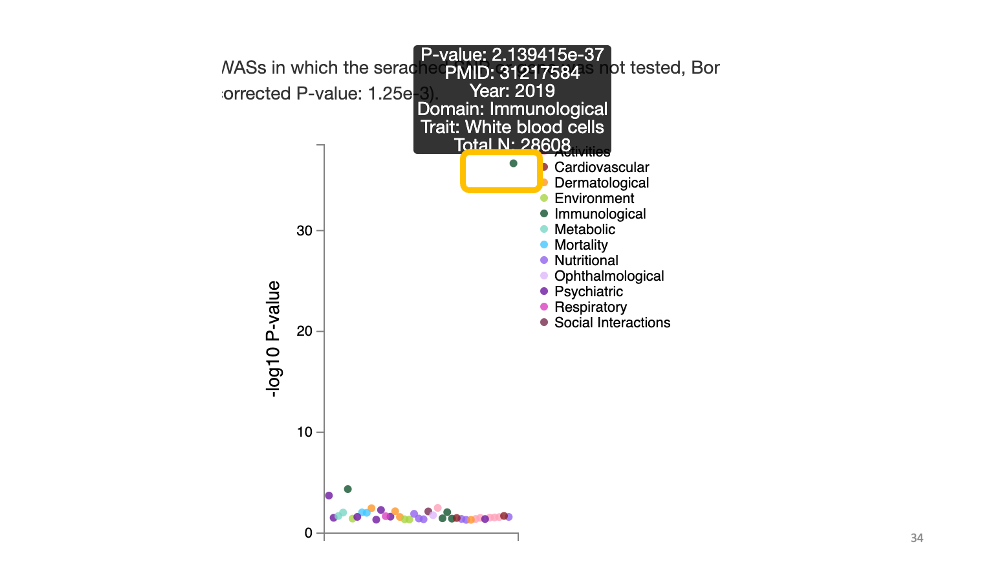
Now, we will learn how to search the genome-wide association study reports of a single nucleotide variant. Let’s search for “rs348195” in GWAS ATLAS.
You will see many colorful dots. Each dot shows each phenotype. Y-axis is the -log 10 P-value of the association - the larger the value is, the stronger the statistical association between the phenotype and variant. In this case, if you put your cursor on the top green dot above “30”, you will see the top association between this variant (rs348195) and white blood cell count.
Now, if you have time, let’s explore another example “rs1543302”.